Introduction
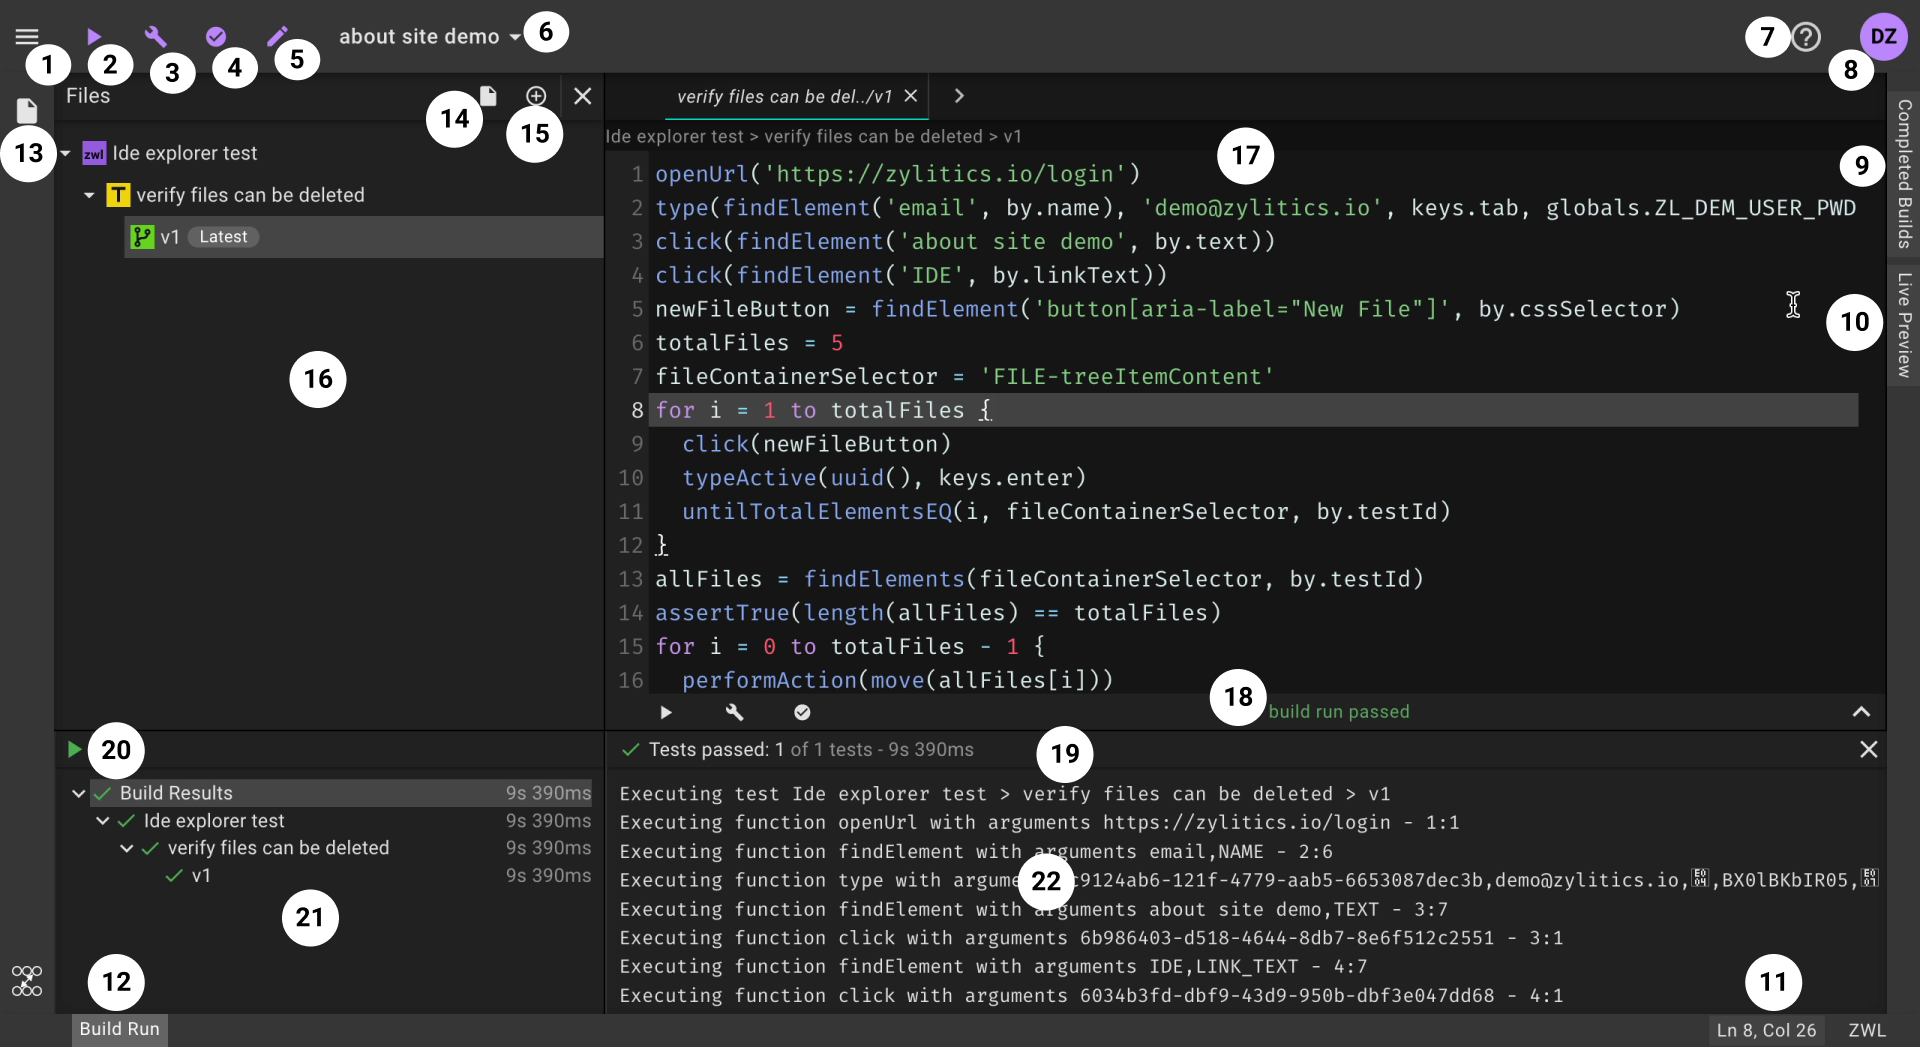
This part of the documentation gives an introduction to the various components of Outomated IDE. You will learn how to use various icons and what they do. Following image shows Outomated IDE with a completed build. Let's go through each of the component that is marked by a number in a circle.
note
We strongly suggest you read this chapter carefully before working on IDE.
Main menu: Contains following:
- Upload test files for
setFile(elemId, fileName)and similar functions that requirefileNameto match a previously uploaded file. - Exit from IDE.
Run Build: Run build for any number of tests.Parse All: Parses all the tests that are currently in explorer.Dry Run All: Dry runs all the tests that are currently in explorer.Edit Menu: Contains following:
- Add/Edit Build Capabilities
- Edit Build Config
- Edit Dry Run Config
- Add/Edit Global and Build Variables
Project: Currently selected project.Help Menu: Get help with IDE.User Info: You account profile, settings and more.Completed Builds: Shows build result and detail of last completed builds from IDE. You need not exit from IDE to view detailed build results. They're embedded within IDE itself.Live Preview: Opens up automatically once a build starts and delivers live preview right from the VM running the build. It closes on it's own too once build completes unless you've closed it before. It is fine to open or close this window any number of times while build is running. Following are few important notes about live preview window:
- Closing it during build will stop delivering live preview.
- Opening it after closing manually will reconnect to live preview.
- Close and Full screen icons are on the left. It can also be closed by clicking on it's tab.
Line Info and Jump to Line: Current line in editor and jump to a line.Build Output Console: Appears once the first build from IDE starts and stays there for current IDE session. Look at following:
- When you start a build, console appears on it's own (if not yet), loads up tests from build and begin to show to progress.
- You can open/close console during build. When opened, it always shows real time output from build.
File Explorer Icon: Open/close file explorer.New File: Opens a text field in explorer for inputting new file name.Load Existing Files: IDE allows you to keep only limited files in explorer at a time to keep workspace clean. Build, Dry run and Parse can see only the files currently loaded into explorer. By Default no file is loaded. Look at following:
- When you visit IDE, click on this icon to load desired files into explorer (if there are some). It opens up a file tree to let you choose desired files to load into explorer/workspace.
- To remove a file from explorer, hover over it, from the icons appeared click on
-in a circle icon to unload file.
File Explorer or Workspace: Renders all the files currently loaded into IDE. You can open, close and resize this window.Editor: The code editor. Once you close or shrink other windows, it expands to the available space. Multiple tests/versions can be opened in editor as tabs.Editor Embedded Output Console: This console is embedded within the code editor. It allows for faster parse, dry run and build of the currently opened test/version in editor (the currently enabled tab in editor). Look at the following:
- This console is meant for displaying the last run (build, dry run or parse) output for the current test/version. This means if you first dry run and parse moments later, the output will show parse result.
- It allows to start all three types of run (build, dry run or parse).
- A build request behaves same as using
Run Build(see 2 in this list) with an exception that you don't have to select tests. The current test/version in editor would be the only test in this build. - A dry run or parse executes within the console.
- It remembers the state of last run for all tests/versions and displays that once they are opened and focused in editor.
- It can't be resized but collapsible.
Output Console: See 'Build Output Console' (at 12 in this list). Similar consoles open up for dry run and parse when initiated for multiple tests. The output console can be opened, closed and resized.Re run: Re runs the build shown in output console. All the tests from build are added into new build. Doesn't open build configuration as long as it has valid values. Helpful when you are debugging, fixing code and need to run same tests again. If you want to make some configuration changes before re running, open build configuration fromEdit menu(See 5 in this list), make changes and re run.note
This re running is different than re running in console. When re running from console, no build detail can be changed because new build just duplicates all captured details.
Output Console Build Result: All files in the last or currently running build. You can click on a test to filter the output shown in right panel. Can be resized.Output Console Test Output: Shows real time output of the entire build. Can be resized.
tip
While everything you require is embedded in IDE, documentation is kept out of it to minimize clutter. We thought embedding documentation in IDE would require you to resize, open, close several windows too many times to keep editor, explorer etc in view. We suggest you keep documentation open in another browser tab during development. This allows full screen space to both of them.